Traffic Analysis – Google Search Console Dashboard
The Traffic Analysis page pulls live data from your connected Google Search Console (GSC) property and displays it in easy-to-read cards, charts and tables. Below is a field-by-field breakdown so beginners can understand exactly what each metric means—and how to act on it.
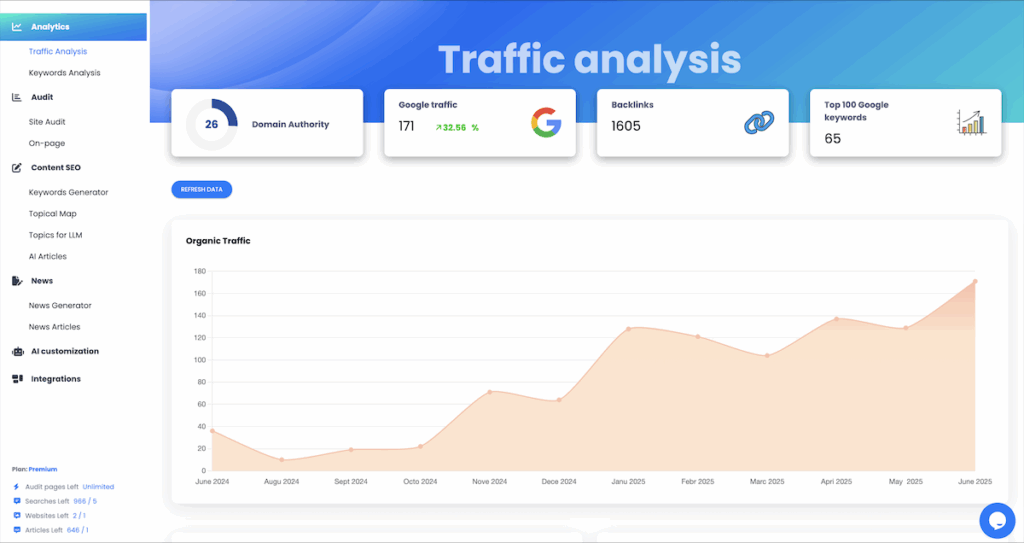
📌 General Overview
At the top of the page you’ll see four summary cards (see Screenshot 1):
- Domain Authority – An in-house score (0-100) combining backlink strength and technical health.
- Google Traffic – Total organic clicks over the selected period, with the green ▲ or red ▼ delta versus the previous period.
- Backlinks – The number of referring domains detected by GSC.
- Top 100 Google Keywords – How many of your keywords currently rank in Google’s Top 100.
Refresh Data button: click any time you want to pull a fresh snapshot from Google.
📈 Organic Traffic Trend
The main line chart shows monthly evolution of organic clicks. Hover over a point to see the exact value for that month. A steady upward slope indicates growing visibility.
📋 Best Organic Keywords
This table lists the keywords driving the most clicks:
- Position – Your average Google rank for the query.
- Impressions – How many times the site appeared for that query.
- CTR % – Click-through rate: clicks ÷ impressions.
- Traffic – Number of clicks generated.
Tip: High impressions but low CTR? Rewrite your meta title to be more enticing.
📊 Distribution of Keyword Positions
A bar chart shows how many keywords fall into each SERP bucket (Top 10, Top 20, Top 30, etc.). Aim to push bars leftward—especially into the Top 10 column.
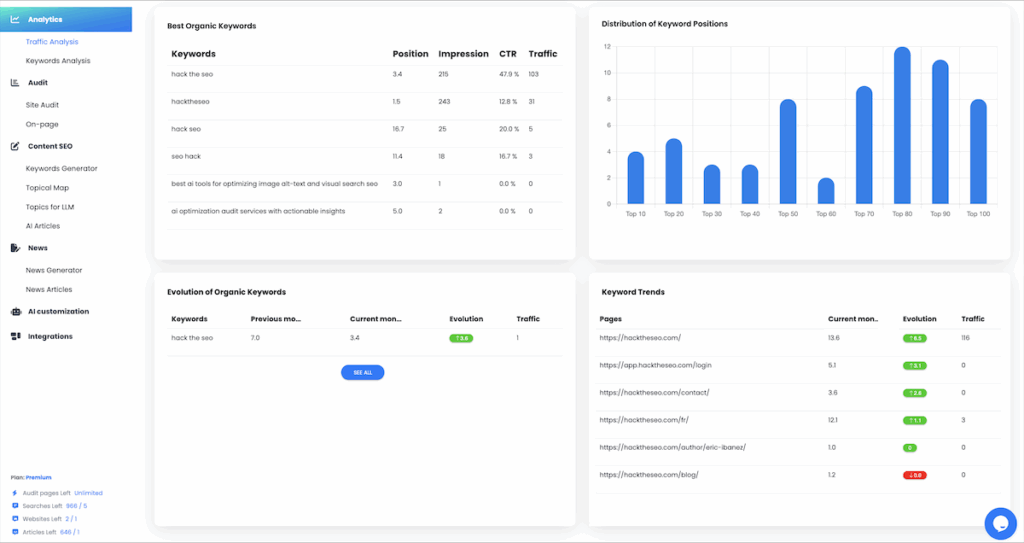
🔄 Evolution of Organic Keywords
Track performance month-over-month for individual queries:
- Previous Month vs. Current Month rank
- Evolution – Green = rank improvement, Red = drop
- Traffic – Clicks this month
Select See All to open the full report. The “Generate article” shortcut lets you spin up an AI article targeting that keyword.
📈 Keyword Trends by Page
This table groups keywords by URL and shows:
- Current Month Position
- Evolution – Green ▲ or Red ▼
- Traffic – Clicks earned by that page
Use it to spot pages that are climbing (double-down) or slipping (optimize content).
🔗 Popular Backlinks
The backlinks table ranks referring pages by page score. High-authority links boost your Domain Authority card above. Click a row to open the backlink in a new tab and examine context.
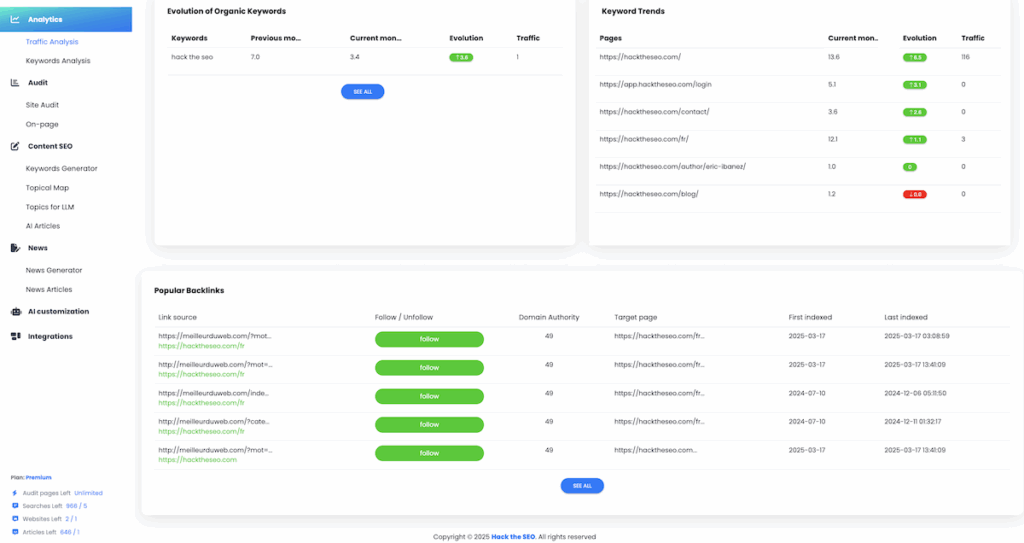
To see all backlinks : https://app.hacktheseo.com/user/backlinks
❓ Frequently Asked Questions
- Why don’t I see any data? Double-check that your GSC property is verified and the exact URL is connected (see Getting Started → Connect GSC).
- How often is data refreshed? Click Refresh Data; otherwise the dashboard updates automatically every 1 month.
- What is Domain Authority here? An internal scoring model—higher is better, but always track the green ▲ trend.
📍 Next Steps
Use the Traffic Analysis insights to pinpoint quick wins: rewrite titles for high-impression/low-CTR keywords, strengthen pages slipping in rank, and pursue new backlinks. When you’re ready, move on to the Site Audit page to fix technical issues that may be holding you back.