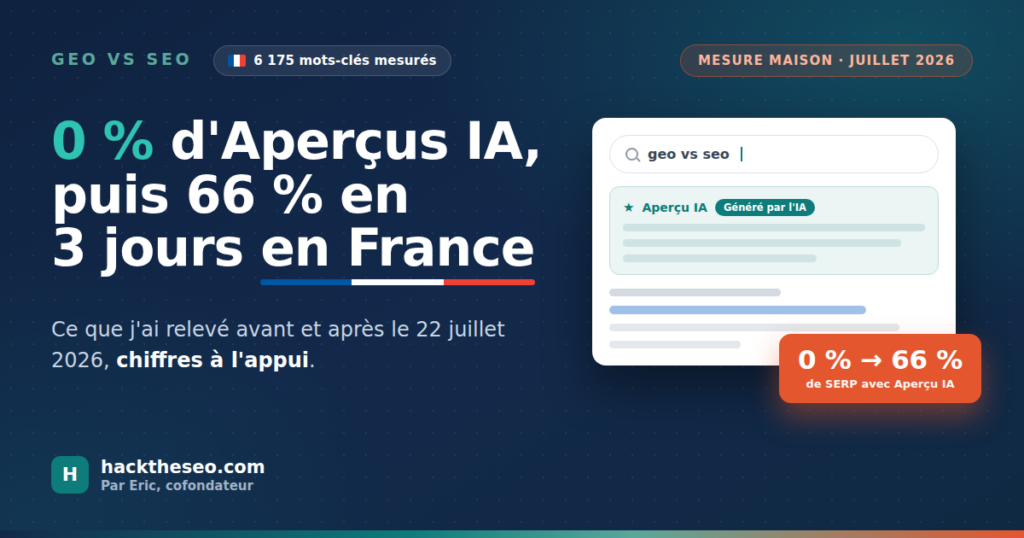
On July 22, 2026, Google switched on AI Overviews and AI Mode in France. Three days later, on my own tracked SERPs, 66.22% of the results pages I follow were showing an AI Overview. Over the previous 64 days, the exact same measurement returned 0.00%. Not 2%, not 0.5%. Zero, across 5,648 French keywords.
Before writing this article, I read the nine pages that share the top 10 for “geo vs seo”. Not one of them contains a French figure. Not one contains an original chart. The page ranking first leans on a statistic credited to Gartner that Gartner never published. So we did the work ourselves, with what we have had on hand for fifteen years: rank tracking exports, 1,300 optimised sites, and the server logs where we watch GPTBot, ClaudeBot and PerplexityBot go by in real time. GEO does not replace SEO, it stacks on top of it, and in France the gap between the noise and the actual numbers has never been this wide.
The 6 things to remember
- 0.00% then 66.22%. Across my 6,175 tracked keywords, not a single SERP carried an AI Overview until July 24, 2026, then 349 out of 527 over the four days that followed (Semrush readings on google.fr, May 22 to July 28, 2026).
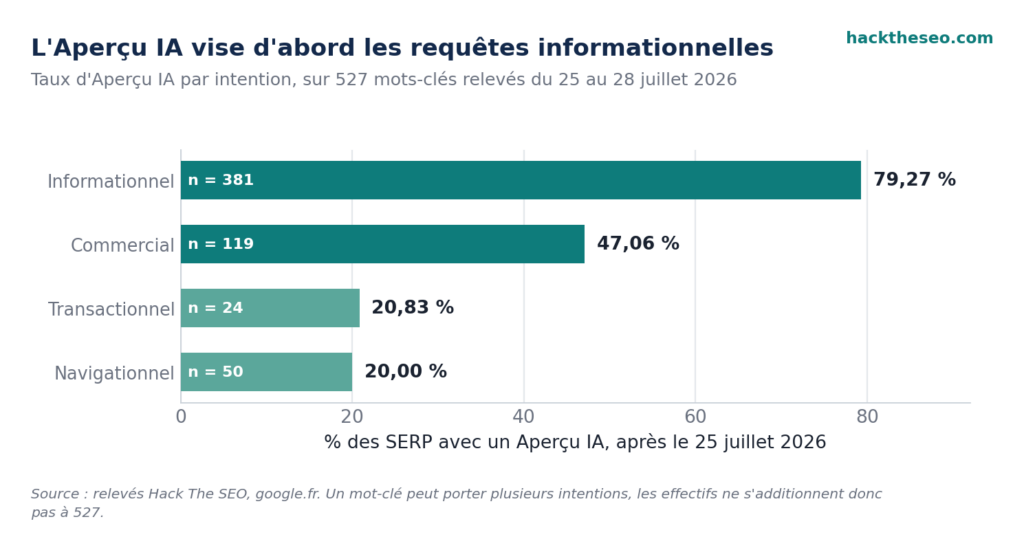
- 79.27% versus 20.00%. The AI Overview fires on informational queries and barely shows up on navigational ones. It targets the intent to know, not the intent to buy.
- 61.76%. Even on the easiest keywords on the market (difficulty 0 to 14), 6 SERPs out of 10 already carry an AI Overview. The easy long tail is not a shelter.
- 0.26% versus 52.76%. AI traffic against organic traffic in France, or 1 visit for every 134 (SE Ranking, 101,574 French websites).
- +120% click-through rate when you are cited inside the AI Overview, 2.07% against 0.94%, and still 38% below a SERP with no AI Overview (Seer Interactive, 53 brands, 5.47 million queries, April 2026).
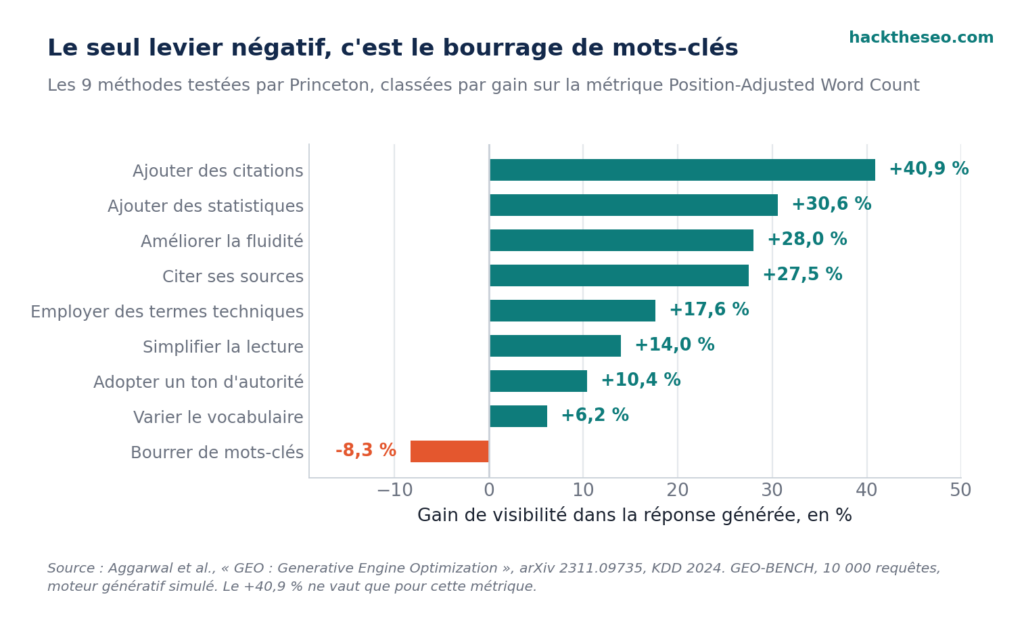
- −8.3%. Keyword stuffing is the only GEO lever in the Princeton study with a negative effect. The one thing twenty years of SEO taught us to do.
SEO and GEO, the short definition (and the acronym trap)
SEO, Search Engine Optimization, is about getting a page to show up in a search engine’s results so a human clicks on it. The unit of success is the click. The signals have been known for twenty years: semantic relevance, technical performance, link popularity. The payback is measured in weeks, inside Search Console, and it is counted in sessions.
GEO, Generative Engine Optimization, is about getting a source cited by a generative engine: Google’s AI Overview, ChatGPT, Perplexity, Claude, Mistral. The unit of success is not the click, it is the citation. The model needs something else: extractable passages, attributed figures, named sources, structure. The payback is measured in days, and it is counted in mentions.
Now the trap. GEO stands for Generative Engine Optimization, not geolocated search. That is the mistake one of the French top 5 articles on this query makes: it spends half its text on business listings and recommends a tool Google shut down in September 2023. I am not naming it, there would be no point, but keep the filter in mind: if the word “local” shows up in the first three paragraphs, close the tab. For the rest of the vocabulary, we keep a SEO and GEO glossary up to date.
What happened in France on July 22, 2026
Google announced the rollout of AI Overviews and AI Mode in France on its French blog on July 22, 2026. On an informational query, a block of text written by a model sits above the classic results, with a handful of source links off to the side. The first blue link, the one we have been fighting over for fifteen years, does not disappear. It moves down.
That calendar detail explains why almost all the French-language content on “geo vs seo” is useless to you today: the top 10 articles were published or updated before that date. They describe a French market where the AI Overview was an American curiosity we watched from a distance. That market existed until July 22, 2026.
The real story is not that Google launched AI Overviews in France. Everyone knew it was coming eventually. The real story is the speed. I was expecting a gradual ramp over a few weeks, the usual Google pattern, with steps and test zones. That is not what I measured. It was a light switch.
What I would do in your shoes: before you read on, open a private browsing window and type your three most strategic queries into google.fr. Thirty seconds and you will know whether this concerns you or whether you still have a bit of runway.
My measurement: 6,175 keywords, before and after
Here is the heart of the article, and the only part nobody can copy. I took fourteen Semrush Organic Positions exports on the google.fr database, covering fourteen domains from our own universe (SEO, marketing, WordPress), which is 6,175 unique keywords tracked between May 22 and July 28, 2026. For each keyword, Semrush records the SERP features present at the time of the reading. All I had to do was count. Before the numbers, the limits, because a figure with no scope attached is exactly what I hold against the nine articles next door.
The two limits of my measurement
- The measured universe is not the whole of google.fr. These are SEO, marketing and WordPress queries, across fourteen domains, pre-filtered to a volume of 50 or more and a difficulty of 29 or less. So overwhelmingly informational. 66.22% means “66% of my SERPs”, not “66% of French SERPs”.
- No keyword was tracked on both sides of July 25. These are two cohorts compared, not a paired follow-up of the same sample. The shift is massive and dated, but I cannot establish cause and effect keyword by keyword, and I am not going to pretend otherwise.
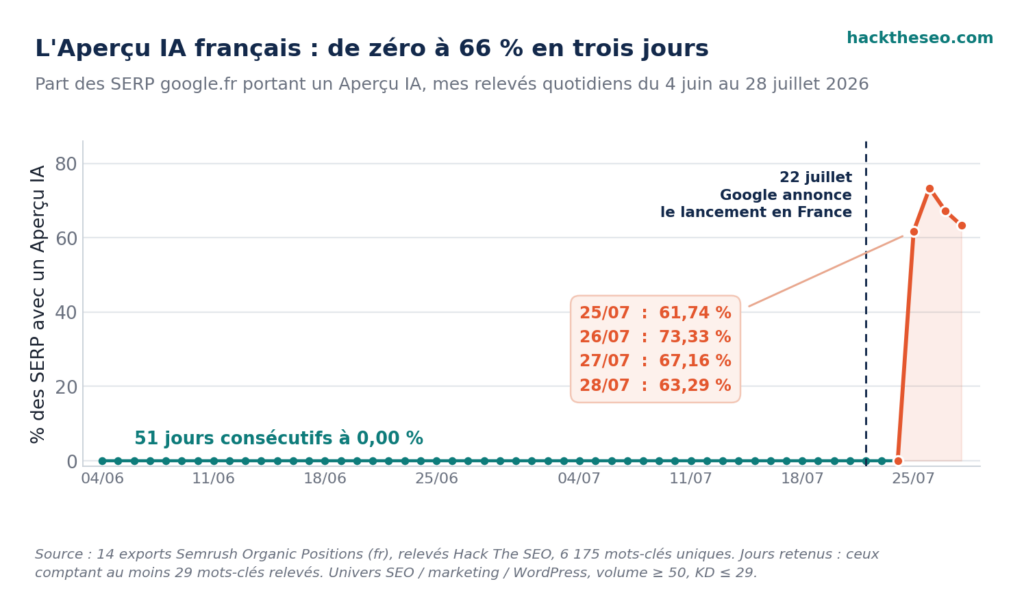
A note on the three-day gap between the July 22 announcement and the first detection on July 25: it does not mean nothing was showing on the 22nd, it means the tracking database took three days to reflect the change. If you follow your rankings with a third-party tool, you have the same blind spot. On switch days, look at the SERP by hand.
| Reading day | Keywords tracked | SERPs with an AI Overview | Share |
|---|---|---|---|
| July 25, 2026 | 115 | 71 | 61.74% |
| July 26, 2026 | 120 | 88 | 73.33% |
| July 27, 2026 | 134 | 90 | 67.16% |
| July 28, 2026 | 158 | 100 | 63.29% |
| Total | 527 | 349 | 66.22% |
By search intent: the AI targets knowing, not buying
Semrush assigns one or more intents to each keyword, so the shares below do not add up to 100%. The gap is no less obvious for it.
| Intent | Keywords | With an AI Overview | Share |
|---|---|---|---|
| Informational | 381 | 302 | 79.27% |
| Commercial | 119 | 56 | 47.06% |
| Transactional | 24 | 5 | 20.83% |
| Navigational | 50 | 10 | 20.00% |
Another read of the same dataset, and an even more telling one: 86.53% of the 349 SERPs with an AI Overview carry an informational intent. (Hack The SEO readings, google.fr, July 25 to 28, 2026) If your traffic lives on explanatory content, guides and definitions, you are the primary target. If you sell, you have a stay of execution.
By difficulty: the easy long tail is not spared
This is the result that surprised me most. Received wisdom says the AI concentrates on big generic queries and leaves the low-competition long tail alone, the one everybody tells you to start with. On my readings, that is false.
| Keyword difficulty | Keywords | With an AI Overview | Share |
|---|---|---|---|
| Very easy (KD 0 to 14) | 102 | 63 | 61.76% |
| Easy (KD 15 to 29) | 425 | 286 | 67.29% |
Six SERPs out of ten among the easiest keywords on the market already carry an AI Overview. Put another way, the strategy we have been recommending to every beginner for ten years, go for the easy long tail to carve out a spot, now comes with an AI block above the first result in most cases. That does not make the strategy bad. It changes what you have to put into it.
What I would do in your shoes: export your Search Console positions over 90 days, filter the queries that start with “how”, “why” or “what is”, and look at the share of your traffic they represent. That is your real exposure, in a single number.
The Featured Snippet, in the same window
While I was counting AI Overviews, I counted Featured Snippets. Same database, exactly the same limits.
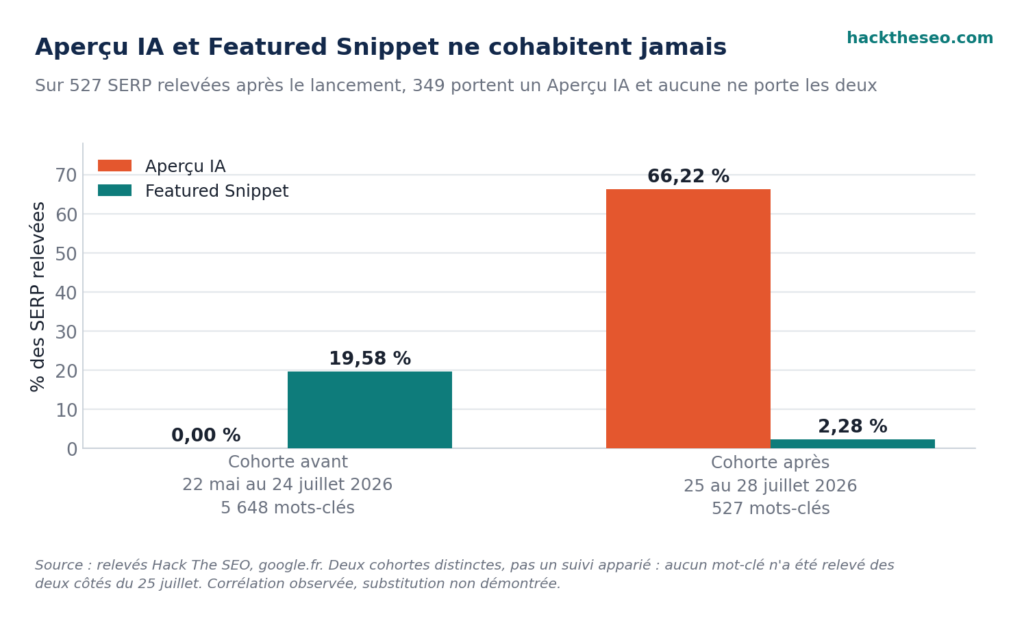
The cross-tab is the sharpest result in the whole measurement. Across the 527 SERPs tracked after launch, 349 show an AI Overview with no Featured Snippet, 12 show a Featured Snippet with no AI Overview, and 166 show neither. On these readings, we have never seen the two together. Not once.
I weigh my words on the interpretation, because this is where everybody skids. The two cohorts show the Featured Snippet’s presence collapsing at the same time as the AI Overview’s presence explodes, with perfect mutual exclusion in the lower cohort. What I do not have is the paired tracking that would let me claim one took the other’s slot on a given keyword. The correlation is spectacular, the causation is not established, and an article selling you the second on the strength of the first is selling you a hunch dressed up as data.
Operationally, it changes things all the same. If your content strategy was built on winning position zero with short definitions and bullet lists, your display target is getting scarce inside my measurement universe. The good news, and it is real: the format that used to win the Featured Snippet, the direct 40 to 60 word answer, is also the one models extract best. The work does not have to be redone, it has to be redirected.
What I would do in your shoes: pull up the pages that used to hold a Featured Snippet, keep the direct answer paragraph, and add what it was missing: a dated figure, a named source, an explicit unit. That is the whole difference between text that reads well and text that gets cited.
The French numbers nobody cites
Here we leave my own measurement and move to published studies. All French, all dated, all with a named organisation and a sample size. This is the material the rest of the top 10 is missing, and it is what gives you the real framing: yes, the display shift has begun; no, the French market has not flipped.
| Source and date | What it says | Scope |
|---|---|---|
| Médiamétrie, L’Année Internet 2025 | 40 million visitors a day on search engines against 7.1 million a day on AI, so 6 times more. 28.1 million monthly AI users (44%), and 78% among 15 to 24 year olds. | French internet audience measurement |
| ARCOM, first AI audience barometer, June 16, 2026 | 33 million French people reached, 57.1% monthly coverage, but AI stays under 1% of time spent online. ChatGPT captures 76% of AI time, Mistral 1%. | Passive measurement |
| CREDOC, Baromètre du numérique 2026 | 48% use generative AI, of which 73% to look up information and 21% daily. 64% check the information they get. | n = 4,145, for Arcep, Arcom, CGE and ANCT |
| OpinionWay for SEO.fr, February 2026 | 98% still use a search engine, 59% use AI. | n = 1,013 |
| SparkToro and Similarweb, January to April 2026 | 65.3% zero-click searches in France, against 68% in the United States. And 271 clicks per 1,000 searches, against 231 in the United States. | Similarweb panel |
| SE Ranking France | 0.26% of traffic coming from AI against 52.76% organic. France sits at 56.4% organic against 44.7% worldwide. | 101,574 French websites |
| StatCounter France, July 2026 | Google at 88.69% of searches. Bing at 11.77% on desktop, but 0.52% on mobile. | Traffic measurement |
| INSEE Première no. 2120, July 21, 2026 | 18% of French companies use AI, below the European average of 20%. | n = 11,000 |
| Autorité de la concurrence, opinion 26-A-05, July 17, 2026 | AI agents generate “less than 5%” of traffic to retail websites in France. | Sector opinion |
| Odoxa for FEVAD | 31% of online shoppers use AI to buy, 58% use it before buying. | n = 1,500 online shoppers |
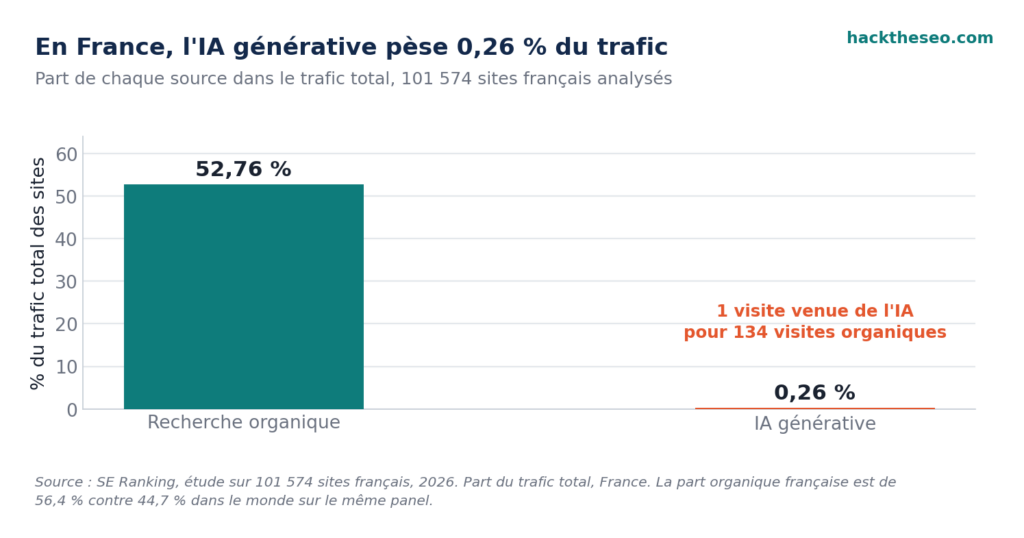
That 1 in 134 ratio is the number I put on the table when a client explains that he wants to “bet everything on AI” in 2026. It is not an argument for doing nothing, it is an argument about sequencing. We broke down the rest of the market numbers, including the American and worldwide data, in our SEO and GEO statistics, which we update as we publish.
Four studies, four answers, and that is normal
44% at Médiamétrie. 48% at CREDOC. 57.1% at ARCOM. 59% at OpinionWay. Four serious organisations, four incompatible figures answering the same question: how many French people use generative AI.
Two explanations, and neither of them is “one of them is lying”. Declarative surveys overestimate compared to passive measurement: you remember trying ChatGPT, you declare it, the panel never sees it. And the definition of “using AI” shifts from one study to the next: once in the month, once in the week, on a service identified as such. The number that actually matters is none of the four, it is ARCOM’s: under 1% of time spent online. You can absolutely have tried it and changed none of your habits.
Three numbers everyone copies that are wrong
Probably the most useful section of this article if you have a budget call to make this week. The three most cited GEO statistics do not say what people make them say.
1. The “70% trust AI answers” credited to Gartner does not exist
Gartner published the opposite. On September 3, 2025, the firm announced that 53% of consumers distrust AI-generated search results, that 41% find AI overviews more frustrating than useful, and that 61% would like to be able to turn them off, on a sample of 377 people. That is the exact reverse of what you read everywhere.
The likely origin of the mix-up is a YouGov survey from July 2026, where the trust being measured was in search engines and not in AI: roughly 72% trust in search engines, against roughly 37% for AI assistants. The figure got flipped and reattributed along the way. Method transparency, since that is the subject of this section: the full YouGov report sits behind a signup wall, I only cross-checked those two values through consistent secondary citations, so I give them as orders of magnitude. What does not move is that the “70%” is circulating in the article ranked first for this query in France, credited to Gartner, with no link to anything.
2. The “76% of AI Overview citations come from the top 10” was revised by its own author
Ahrefs, who published that figure, brought it down to 37.9% on March 2, 2026, on a base of 863,000 SERPs and 4 million URLs, pointing to the arrival of Gemini 3 and the spread of query fan-out. BrightEdge finds separately that only around 17% of sources cited in AI Overviews also appear in the organic top 10. The 76% is still the most recycled figure on the web on this subject, and it is the argument for everyone explaining that ranking well is all you need to get cited. That has not been true since March.
3. The “Princeton +40%” does not mean what people make it mean
The +40.9% is real, but it holds for one method (adding citations), on one metric (Position-Adjusted Word Count), on a simulated generative engine. Exact reference: arXiv 2311.09735, published at KDD 2024, GEO-BENCH benchmark, 10,000 queries. On the subjective impression metric, the best lever tops out at +28%. And the real test on Perplexity, across 200 samples, gives +22%. It is still an excellent result. It is simply not “+40% guaranteed AI visibility”, which is what you read on just about every GEO agency sales page.
A bonus, because it comes up in every board meeting: the Gartner forecast of a 25% drop in search volume by 2026 dates from February 19, 2024, comes with no published methodology and no published sample, and has never been revised. Google wrote on May 19, 2026 that its queries had reached an all-time high. A 2024 forecast against a 2026 statement: I am not telling you which to believe, I am telling you that you cannot cite the first while ignoring the second. We keep the running list of corrected figures in our SEO and GEO statistics.
There is a delicious irony in this section. GEO is about becoming the source that models cite, and models also learn from those very articles. Every page that copies Gartner’s fake 70% without checking it trains generative engines to repeat it. We are collectively manufacturing the hallucinations we will complain about in six months.
What I would do in your shoes: before publishing a figure, go back to the primary source, the study itself and not the article quoting it. If you cannot find the organisation’s own page in three clicks, the figure probably does not exist.
The 9 GEO levers, ranked by actually measured gain
Here is the table nobody publishes in full, even though it has been sitting in the Princeton study since 2024. Nine methods tested, nine gains measured, in order.
| Lever | Measured gain | What it means in practice |
|---|---|---|
| Adding citations | +40.9% | Naming works, reports and studies inside the body text |
| Adding statistics | +30.6% | Replacing “a lot” with a number, with its unit and its date |
| Improving fluency | +28.0% | Sentences that flow, not blocks of keywords stacked together |
| Quoting sources | +27.5% | Attributing every claim to an identifiable organisation |
| Technical terms | +17.6% | Using the precise vocabulary of the field instead of paraphrase |
| Easier reading | +14.0% | Lowering syntactic complexity without thinning the substance |
| Authoritative tone | +10.4% | Stating things, instead of piling up hedges |
| Varied vocabulary | +6.2% | Avoiding mechanical repetition of the same term |
| Keyword stuffing | −8.3% | The only lever in the entire study with a negative effect |
Take thirty seconds on that last row. The only negative lever in the study is the only one twenty years of SEO taught us to do. Keyword density, occurrences in the H2s, semantic variants repeated: everything a generation of tools flagged green produces the opposite effect here. The eight positive levers describe something very simple and very old: writing a good article, sourced, quantified, readable. GEO rewards journalism.
What the French-language corpus completely ignores
Four subjects appear nowhere in the nine top 10 articles, even though they are the four questions clients actually ask us.
The robots.txt for AI crawlers. GPTBot, ClaudeBot, PerplexityBot and Google-Extended are blocked line by line. What does not get said enough: blocking Google-Extended does not keep you out of the AI Overview, which draws on the classic search index, and blocking GPTBot removes you from ChatGPT’s answers without protecting you from much, since your content keeps circulating through other sites’ citations. It is a licensing call, not a security one.
The llms.txt file. No major generative engine has publicly committed to reading it as of today. It costs ten minutes, it breaks nothing, and it forces you to write a clean description of your site. We put a llms.txt generator out there for free for that. Drop it in, tick the box, move on. Anyone selling you a four-figure llms.txt engagement is trading on the confusion.
Answer volatility. Ask a generative engine the same question three times three days apart: you will not get the same cited sources. It is structural, and the consequence for reporting is direct, a single reading means nothing, you need a series. That is the logic behind our GEO score, which measures a page’s extractability signals rather than its presence on a given day.
Engine-by-engine differences. Google’s AI Overview leans on its index. Perplexity runs its own live search. ChatGPT combines training memory and browsing. Optimising “for AI” as though it were a single entity is optimising “for search engines” in 2005 while ignoring that Google and Yahoo did not run the same algorithm.
Look at the list of eight positive levers and ask yourself the real question: how long does it take to apply them across 300 pages. One sourced citation, one dated statistic and clean markup per page is twenty minutes. Multiplied by 300, that is a hundred hours. GEO is not intellectually hard, it is expensive at scale, and that is why we spent the year building a SEO and GEO plugin for WordPress that automates these signals across the whole site. Shipping September 2026. I am promising you no numbers, I am telling you what it does: topic clusters, internal linking, a GEO score per page, llms.txt generation and AI bot tracking in your logs.
What I would do in your shoes: take your ten highest-traffic pages and, on each one, add a sourced and dated statistic in the first two paragraphs. One hour of work in total, on the two best-rated levers in the study.
The big table: SEO vs GEO
The comparison you came for, with two columns I have not seen anywhere else: what you actually measure, and the French figure that goes with it.
| Dimension | SEO | GEO | What you measure | Our France figure |
|---|---|---|---|---|
| Goal | Show up in the results | Get cited as a source | Positions against mentions | 0.26% of traffic comes from AI |
| Unit of success | The click | The citation | Sessions against appearances | 52.76% organic against 0.26% AI |
| Main signal | Links, relevance, technical | Extractability, sources, figures | Backlinks against citable passages | +40.9% for adding citations |
| Time to payback | Weeks to months | Days | Impression curve against readings | 3 days between announcement and detection |
| Measurement tool | Search Console, Semrush, Ahrefs | Manual readings, AI bot logs | Google data against direct observation | No official tool on the AI side |
| Cost of entry | High, competition is entrenched | Low today, the space is open | Cost per position against cost per rewritten page | 9 competitors without a single French figure |
| Main risk | Algorithm update | Volatility, no display guarantee | Lost positions against lost citations | Answers that vary from one day to the next |
| Effect of July 22, 2026 | The blue link moves down | A display surface appears | Share of SERPs with an AI Overview | 0.00% then 66.22% in three days |
My verdict
The two truths in this article contradict each other, and both are sourced. France is the least AI-dependent large Western market I have seen measured: 0.26% AI traffic, under 1% of time spent online, 98% of French people still using a search engine, less than 5% of retail traffic coming from AI agents. And at the same time, the display shift did happen, dated, in three days, in front of me.
Both hold because they are not talking about the same thing. One is about where the traffic comes from. The other is about what shows up above your results. And the second always comes before the first.
GEO does not replace SEO, and our numbers say it better than the nine articles that assert it without having measured anything: 1 AI visit for every 134 organic visits in France. Anyone advising you today to shift your budget over to GEO is not looking at French data, or does not have any.
But getting cited in the AI Overview moves the click-through rate from 0.94% to 2.07%, so +120%, while still sitting 38% below a SERP with no AI Overview (Seer Interactive, 53 brands, 5.47 million queries, April 24, 2026). And the randomised experiment by Agarwal and Sen, across 1,065 users, establishes a causal effect of −39.8% on outbound organic clicks and +34.5% zero-click searches. The pie is shrinking, and the only slice that keeps its value is the cited source’s. This is not a new job, it is the same one with an extra layer, and that layer rewards precisely what industrial SEO had learned to neglect: sourcing, quantifying, dating, writing readably.
What I would do in your shoes, in this order:
- This week. Measure your real exposure: the share of your traffic on informational queries, and the presence of an AI Overview on your ten main queries, checked by hand.
- This week too. Open your server logs and look for GPTBot, ClaudeBot, PerplexityBot and Google-Extended. Know who is crawling you before deciding who you block.
- This month. Rewrite the ten most exposed pages applying the top two Princeton levers: one named citation and one dated statistic in the first two paragraphs.
- This month. Drop in a clean llms.txt, tick the box, and stop thinking about it.
- By the end of the summer. Set up a recurring reading, even a homemade one. A spreadsheet, ten queries, once a week. The series is worth infinitely more than the one-off reading, and in six months you will be the only one in your market holding a French history.
Frequently asked questions
What is the difference between SEO and GEO?
SEO aims to get a page to appear in a search engine’s results so a human clicks on it: the unit of success is the click. GEO, Generative Engine Optimization, aims to get a source cited by a generative engine such as Google’s AI Overview, ChatGPT or Perplexity: the unit of success is the citation. The second adds to the first, it does not replace it.
Does GEO replace SEO in 2026?
No, and the French numbers are conclusive. Traffic from generative engines weighs 0.26% in France against 52.76% for organic, so one visit in 134 (SE Ranking, 101,574 websites). ARCOM separately measures AI at under 1% of time spent online. GEO is an additional layer, not a replacement.
Are AI Overviews available in France?
Yes, since July 22, 2026. Google switched on AI Overviews and AI Mode in France that day. On my own readings of 6,175 keywords, the share of google.fr SERPs carrying an AI Overview went from 0.00% to 66.22% between July 24 and July 28, 2026, on a universe of mostly informational queries.
How much traffic actually comes from AI in France?
0.26% of French websites’ traffic comes from generative engines, against 52.76% from classic organic search (SE Ranking, 101,574 websites). The Autorité de la concurrence estimates in its opinion 26-A-05 of July 17, 2026 that AI agents generate less than 5% of traffic to French retail websites. AI traffic exists, it stays marginal.
Do AI Overviews really reduce clicks?
Yes, and it is causally established. The randomised experiment by Agarwal and Sen (SSRN 6513059, 1,065 users) measures −39.8% outbound organic clicks and +34.5% zero-click searches. Seer Interactive observes a click-through rate 38% lower on SERPs with an AI Overview, but +120% for the sites cited inside it, so 2.07% against 0.94%.
How do you optimise content to get cited by an AI?
The Princeton GEO study (arXiv 2311.09735, KDD 2024) ranks nine methods. The most effective: adding named citations (+40.9%), adding statistics (+30.6%), improving fluency (+28.0%) and attributing sources (+27.5%). Keyword stuffing is the only lever with a negative effect (−8.3%). In practice: source it, quantify it, date it, write it readably.
Should you block AI crawlers in your robots.txt?
It is a licensing call, not a security one. Blocking Google-Extended does not remove you from the AI Overview, which draws on the classic search index. Blocking GPTBot removes you from ChatGPT’s answers without stopping your content from circulating through other sites’ citations. Decide on the value of your content, not on a defensive reflex.
Sources
My measurement
- Hack The SEO, Semrush Organic Positions readings on google.fr, 14 domains, 6,175 unique keywords, May 22 to July 28, 2026. Filter applied: monthly volume of 50 or more, difficulty of 29 or less.
The French launch
- Google France, launch of AI Overviews and AI Mode in France, July 22, 2026
- Google, “queries reach an all-time high”, May 19, 2026
The French figures
- Médiamétrie, L’Année Internet 2025
- ARCOM, audience barometer for artificial intelligence services, 1st edition, June 16, 2026
- CREDOC, Baromètre du numérique 2026, n = 4,145, for Arcep, Arcom, CGE and ANCT
- OpinionWay for SEO.fr, French search habits, n = 1,013, February 2026
- SE Ranking, AI traffic in France, 101,574 websites analysed
- SparkToro and Similarweb, zero-click searches by country, January to April 2026
- StatCounter, search engine market share in France
- INSEE Première no. 2120, AI use by French companies, July 21, 2026, n = 11,000
- Autorité de la concurrence, opinion 26-A-05 on artificial intelligence agents, July 17, 2026
- Odoxa for FEVAD, AI adoption among online shoppers, n = 1,500
The impact on clicks
- Seer Interactive, impact of AI Overviews on Google CTR, April 24, 2026, 53 brands and 5.47 million queries
- Agarwal and Sen, randomised experiment on AI Overviews, SSRN 6513059, revised July 8, 2026, 1,065 users
GEO levers and corrected figures
- Aggarwal et al., GEO: Generative Engine Optimization, arXiv 2311.09735, KDD 2024, GEO-BENCH benchmark
- Ahrefs, revision of the share of AI Overview citations coming from the top 10, March 2, 2026, 863,000 SERPs and 4 million URLs
- BrightEdge, share of cited sources also present in the organic top 10
- Gartner, 53% of consumers distrust AI-powered search results, September 3, 2025, n = 377
- Gartner, forecast of a 25% drop in search volume by 2026, February 19, 2024
- YouGov, Web Search and AI report 2026, July 2026 (full report behind signup, values cross-checked through secondary citations)